
These weather pages are based on data from a high resolution implementation of the WRF-ARW weather model to the region of the Arid Andes of Chile and Argentina between latitudes 27 to 32 south and longitudes 72.5 to 67.5 west. The model consists of two nested domains at 9 km and 4 km cell size. It uses the data from the GFS 0p25 as initial and boundary conditions. In the operational run it is updated twice a day with data from the GFS 00z and 12z runs.
GFS is the acronym of Global Forecast System, which is run four times a day by the US National Weather Service. The outputs are available at 2.5, 1, 0.5 and since January 2015 at 0.25 degrees of resolution.
The Weather Research and Forecasting (WRF) Model "is a next-generation mesoscale numerical weather prediction system designed to serve both atmospheric research and operational forecasting needs. It features two dynamical cores, a data assimilation system, and a software architecture facilitating parallel computation and system extensibility" [1]. The WRF is a collective effort by many scientists over the world and is regularly updated and upgraded.
On mountain regions the resolution of the model is important in order to simulate the impact of topography on weather systems. At 0.25° or 0.50° resolution, global models do not represent mountain ranges accurately, missing the highest elevation by thousands of meters. It is therefore necessary to downscale the results using models that can run over a smaller region but at higher resolution.
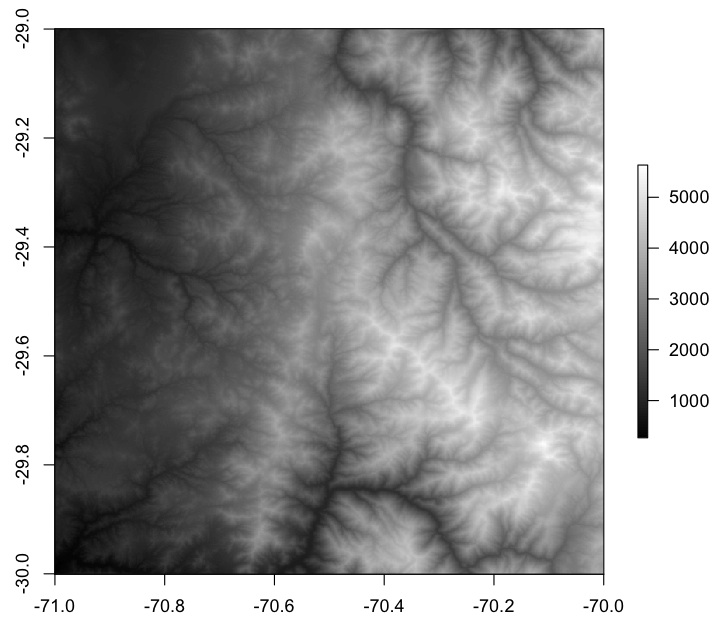
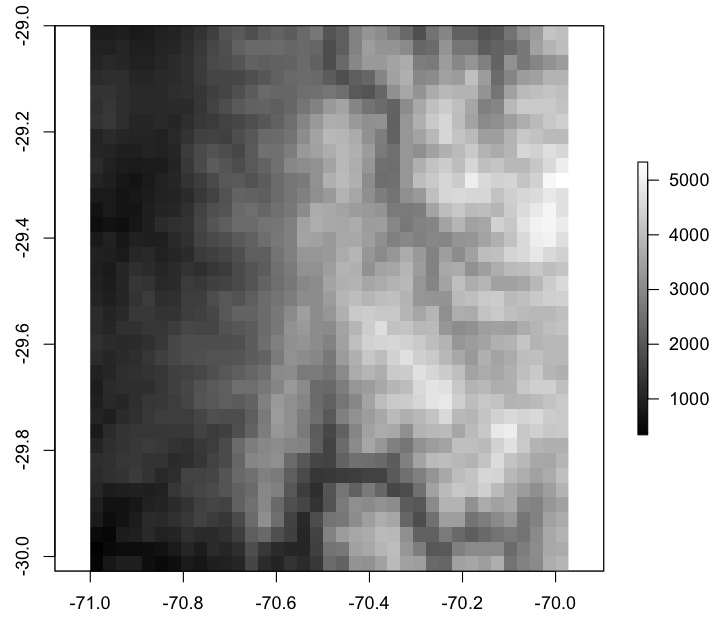
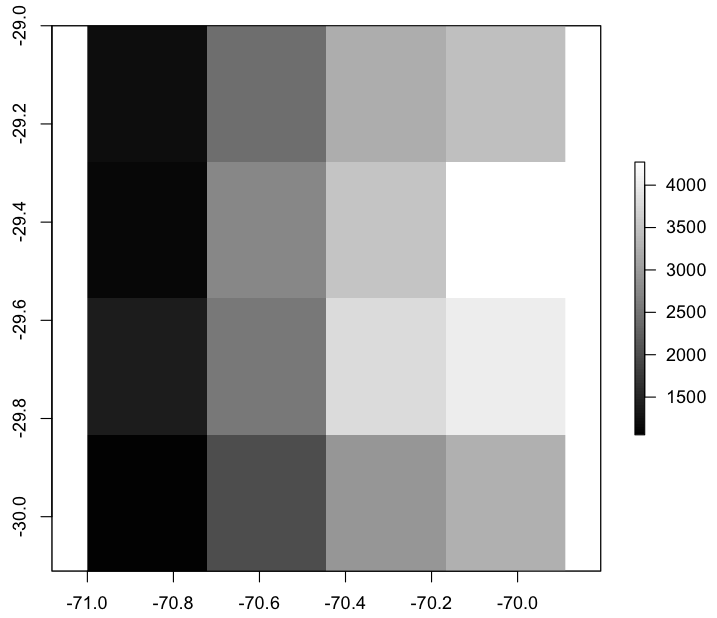
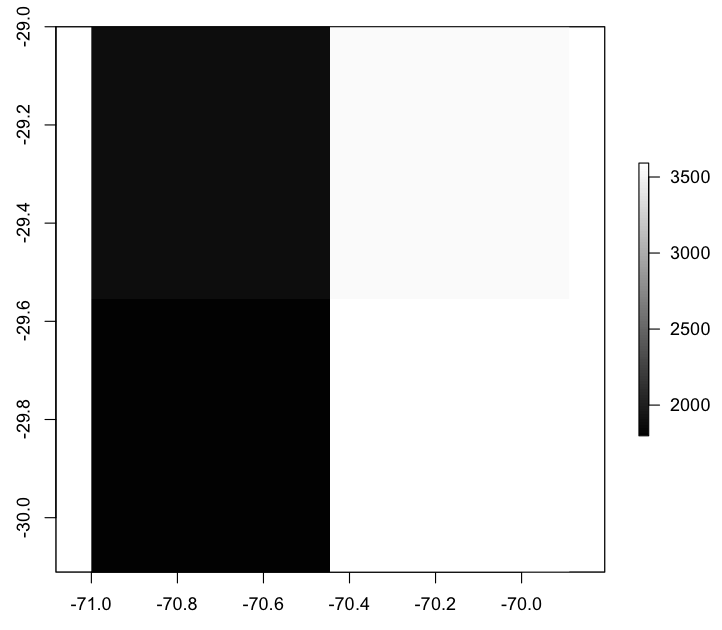
An example of the importance of resolution is illustrated in Figure 1. As resolution decreases, the relief is smoothed and elevation decreases. Weather models at lower resolution cannot discriminate the impact of mountains, such as wind drag, wind channelling, orographic precipitation, etc. and therefore are less reliable than higher resolution models.
 |  |
| a) 30 m | b) 3 km |
 |  |
| c) 30 km | d) 60 km |
Figure 1 Digital Elevation Model (DEM) of the Arid Andes at different resolution (30 m, 4 km, 30 km and 60 km). Note the highest elevation is in excess of 5000 m at 30 m and 4 km, and only 3500 m at 60 km resolution.
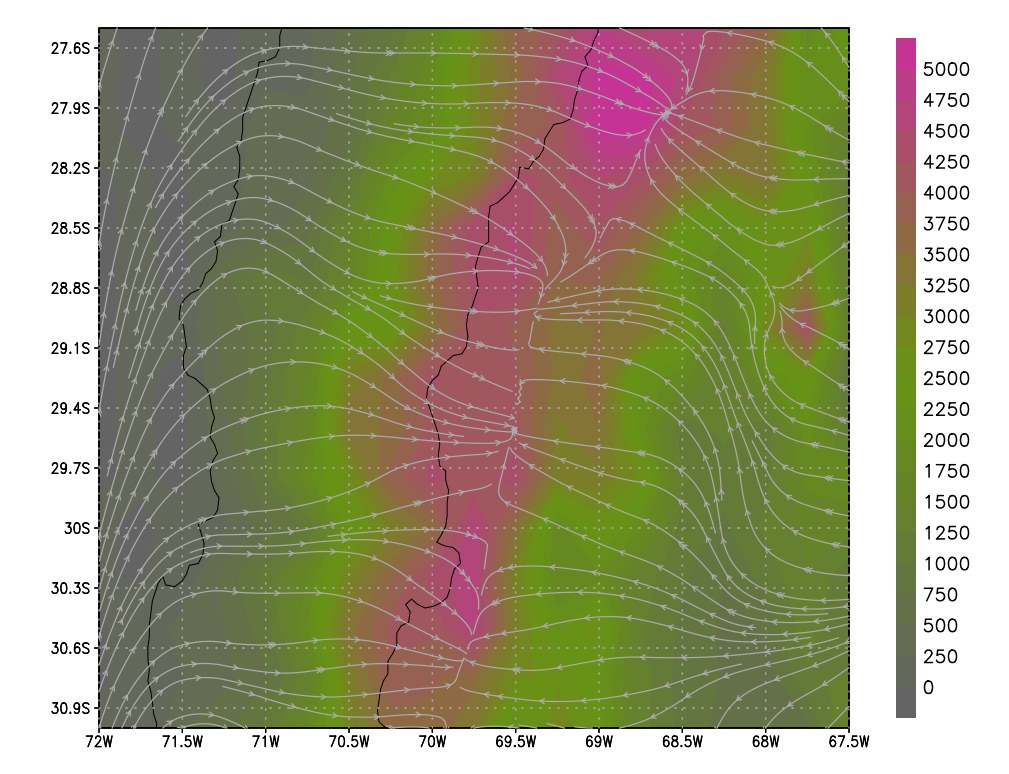
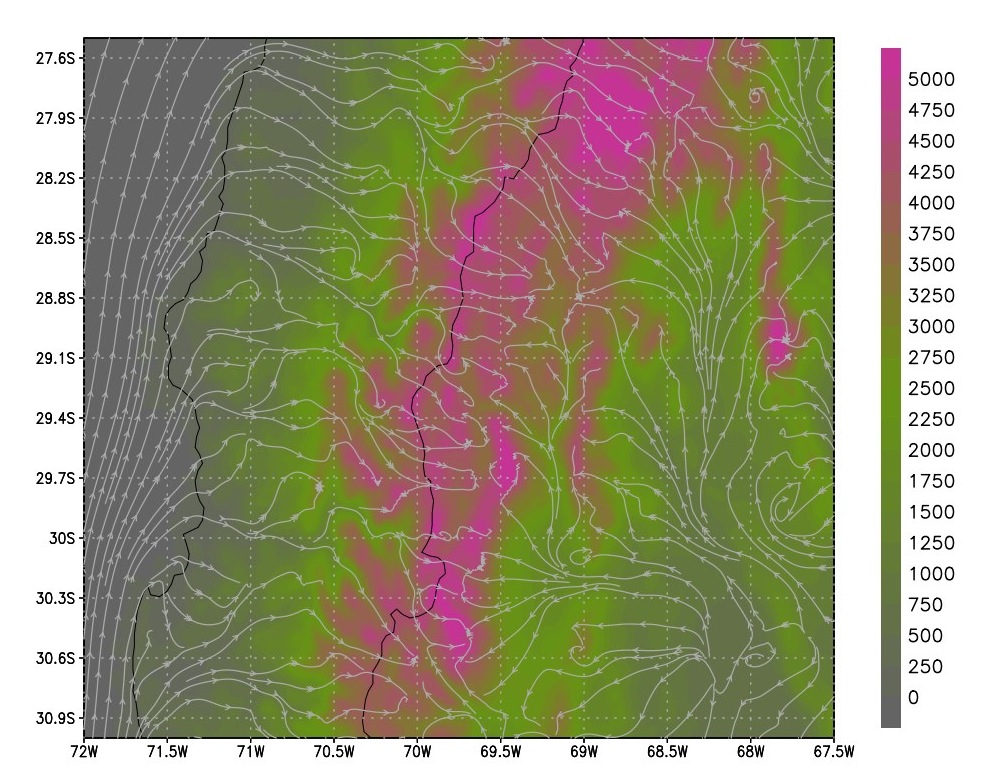
These differences in resolution have a strong impact when modelling wind speed as seen in Figure 2. Note how the WRF, on the right panel, can identify individual valleys and how the wind streams follow the main valleys. This in turn will affect wind velocity and therefore wind energy forecasts, wind potential or the exposure of workers in operations at high altitude.
 |  |
| a) GFS 0p25 | b) WRF 3 km |
Figure 2. Surface elevation and wind streams over the Central Arid Andes of Chile And Argentina. On the left panel a GFS simulation at 0.25° resolution, on the right panel a WRF simulation at 4 km resolution.
High resolution modelling also have advantages when simulating solar energy, precipitation, snow melt and runoff and many other meteorological parameters.
Navigation to different sections and data is provided by a navigation tool on the upper section of the web page, as shown in Figure 2. Every link in the navigation bar is described below.
 |
| Figure 2 Navigation bar. |
The entrance page is an interactive map of the region where data on several points and stations can be visualize quickly. The map features locations where a full forecast is provided, points where the atmospheric vertical profile is calculated and displayed, and reporting stations when data is available. These last include the Huasco River stations (Red de Vigilancia de la Cuenca del Huasco) and the METAR report from airports in the region.
The information is obtained by hovering over the following symbols on the map, when a window appears with the corresponding data:
 Weather forecast from a high resolution WRF model. Information is shown as an interactive chart plotting the most important variables.
 Skew-T diagrams and 48 h evolution derived from the WRF model at 4 km resolution. The chart can be animated and the figure enlarged on a new window when clicking on it.
 Skew-T diagram from the new GFS 0p25 model. There are additional points in the Pacific and inland, visible when reducing the zoom level.
 Hydro-meteorological stations from the Huasco River catchment.
 Most recent METAR report from the indicated airport.
 The map can be expanded to full screen by clicking on the symbol  on the upper right corner. The map base layer can be changed from satellite to relieve with the layer selector
  on the upper right hand corner.
Zoom by using controls + - on the upper left corner. You may also zoom by double-clicking on the map.
Forecasts are given as an interactive chart showing the output of the WRF model for the next 48 h and for selected variables (Figure 3). Additional charts are given for the GFS model in the "Chart" section of the web site.
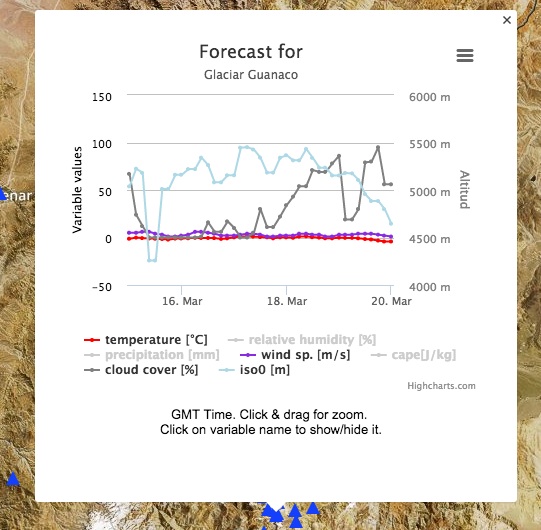 |
| Figure 3 Pop up window for the forecasts symbol on the map (blue triangle). The variables can be shown or hidden by clicking on the variable name in the legend. It is possible to zoom to some region of the chart by click and drag. |
By hovering on the blue or purple dots, a pop up window will show a skew-T vertical profile of the atmosphere at that point (Figure 4). The profiles are shown for 48 h at one-hour interval for the WRF model and for 96 h at three-hour interval for the GFS model. By clicking on the profile chart the image is enlarged in a new window. The set of profiles can be animated. The slider allows selecting any point in time. A link is provided to the profiles section, where charts are shown at larger size.
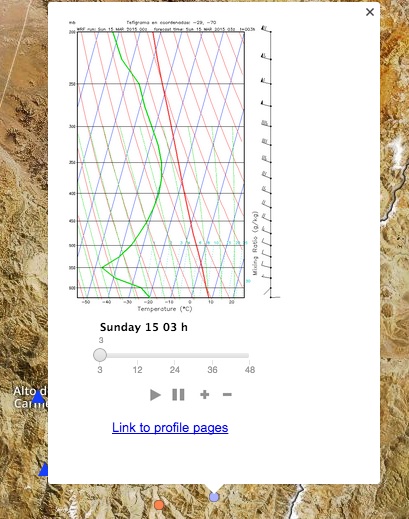 |
| Figure 4 Pop up window for the vertical profiles (skew-T diagrams). |
Similarly, by hovering on the orange dots, the temperature, humidity, precipitation, and river flow for the Huasco stations are shown. River flow is only available for the Embalse de Santa Juana. Hovering over the red rectangle the METAR information for the corresponding airport is displayed. Please note that some Argentinian airports do not update their METAR reports daily.
The GFS maps section shows weather charts of different meteorological variables at 3h interval for the next four days. The forecast time can be selected by moving the range slider, on the left side of the page. Charts can be animated by clicking on the animation control.
It is possible to compare the GFS and WRF outputs by moving to the corresponding page through the navigation menu. When changing the page the system keeps the same variable and time step on display.
Weather maps are given for day one through day four, for a longer forecast choose the GFS maps long range option from the navigation menu. The time range is divided in two periods to speed up the upload of the page.
This page shows additional GFS maps for the long term forecast, from day 5 to day 10. After 5 days the reliability of forecasts decreases rapidly, so they are shown in this additional page. This page may take some time to upload on a slow internet connection. For the long-term forecasts is also advisable to check the ensemble forecasts.
The WRF maps section shows weather charts of different meteorological variables at hourly intervals for the next 48 h. The forecast time can be selected by moving the range slider, on the left side of the page. Charts can be animated by clicking on the animation control.
As with the GFS charts it is possible to move between the two sections while keeping the same variable and time step on display.
The forecasts section gives a quick glimpse of the weather conditions for the next 10 days. The first five days are shown at 6h interval, while for day one to ten a day summary is provided. From zero to 48 h the forecasts are based on the WRF model, for the rest of the period they are derived from the GFS 0p25 model. For higher temporal resolution, please check the interactive chart section. Some astronomical parameters for the sun and moon are also provided.
When selecting Punta Colorada Wind Farm, the wind speed at 80 m above ground level (AGL) is also provided, this is the height of the hub of the wind turbine. This information may be useful for predicting wind energy output.
To provide a general overview of the situation in the region satellite images from GOES East are provided, these shown the full disk in the visible, infrared and water vapour bands.
The Charts section is subdivided into interactive charts, profiles and ensembles:
This section show the data at full temporal resolution for selected variables. It shows both the WRF and GFS outputs in the same page. WRF has a temporal resolution of one hour, while the temporal resolution of GFS is three hours. To compare both models the range of the GFS chart can be adjusting through zooming (click and drag).
This page shows the skew-T diagram from the surface to a pressure level of 200 mb. Inside the page the location of the profile can be selected from a drop down menu. The selected location is displayed in the enclosed map.
Ensembles are produced from the GFES at 1° resolution. Ensembles are a set of forecasts with slight variations in the initial conditions. The colour line is the actual GFES run, the grey shadow is the dispersion of forecasts with different perturbation in the initial conditions, the dark grey line is the ensembles mean.
If the grey shadow is wide it means that small initial differences lead to very different results, and that indicates a less reliable forecast, if the grey shadow is narrow the forecasts are more reliable.
The settings page allows selecting alert levels and providing a mobile telephone to receive the information. The alert levels are threshold values that trigger a response when the forecast goes beyond that level. It can be set for every individual user. If the alert is triggered the user will receive an alert email. If the telephone number is set and valid, the user will also receive an alert via sms to the designated cellular phone.
This page also allows setting the language and metric system. The metric system change only affects the forecast page and the local calculations in this page (wind chill factor). A set of conversion tools is also provided.