Solar radiation maps are an important source of information for environmental and ecological studies, architecture planning or thermal and photovoltaic power generation. Contact us if you need maps for a different region or at a different spatial or temporal resolution.
Map navigation
Change layers between potential solar radiation (clear skies with atmosphere) and actual average solar radiation for local climatic conditions by clicking on the layer symbol at the upper-right corner of the map.
Display the colorbar legend by clicking the info sign on the lower right corner.
Change zoom and opacity by clicking the signs or sliding the transparency control on the upper left corner.
The map reaches zoom level 12, that is when the scale bar shows 1 mile or 3 km, and 1 pixel corresponds to 100 m, later you may zoom to the highest resolution satellite layer, but the solar radiation is not visible.
You can use the map in full screen mode by clicking the full screen symbol on the upper left corner, below the zoom.
Search locations is enabled by clicking on the search magnifier, clicking it again hides the search box
Solar Radiation Map
Map of the anual average of daily solar radiation on the surface slope for the province of Granada, Spain, at 100 m resolution.
By clicking on a point of the map a chart popup will display four values for solar radiation:
Global insolation on on the slope of the terrain (GSI),
Global insolation on a horizontal surface (GHI)
Direct normal insolation (DNI)
And diffuse insolation.
The global values include the diffuse component modified by skyview factor.
How these maps are made
For Potential solar radiation the calculation takes into account shading, horizon obstruction, average temperature, humidity and sky clearness but consider every day a clear day without clouds. Thus this would be the maximum average solar radiation available at every location.
We calculate the position of the sun every hour from sunrise to sunset as a 3D vector, the vector normal to every grid cell of the Digital Elevaton Model (DEM), hillshading and cast shadows following Corripio (2003). Julian date, astronomical position and sun-earth radius vector are computed following Bourgues (1985), Danby (1988), Meeus (1999) and Rada and Andreas (2003). For the atmospheric attenuation of solar radiation through the atmosphere (transmittance) we use a parametric model by Bird and Hulstrom (1981a,b) with updated values for the solar constant con valores actualizados de la constante solar (Kopp and Lean 2011). We have double-checked the performance of this model with the radiative trasfer model MODTRAN 4 and gives excelent results, as well as in other intercomparison studies (Niemelä et al. 2001). Direct radiation is modified by the angle of incidence on the surface. For diffuse radiation we take into account the sky view factor and the albedo of the surrounding terrain.
Below there are some graphic examples of the terrain modelling:
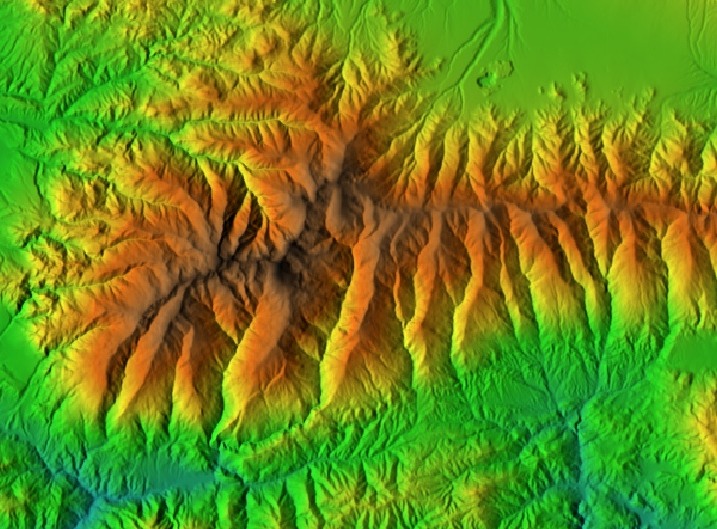 DEM of the Sierra Nevada. |
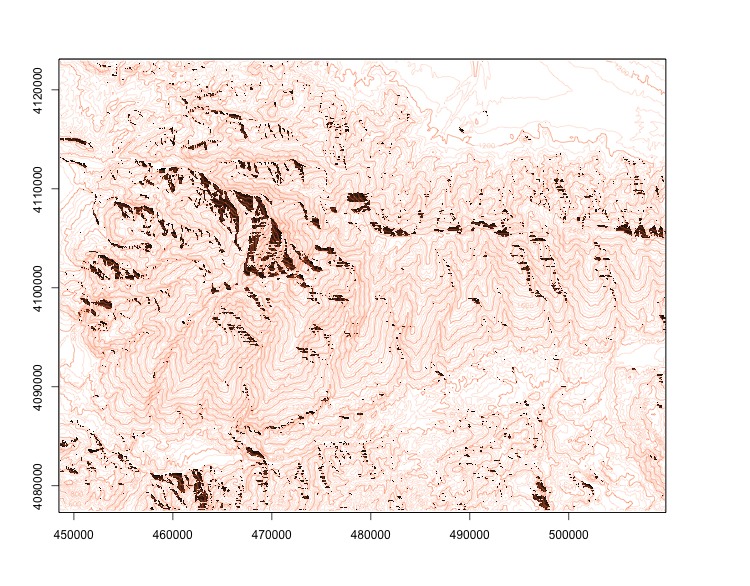 Cast shadows in Sierra Nevada with sun at 25° elevation, 215° azimut. |
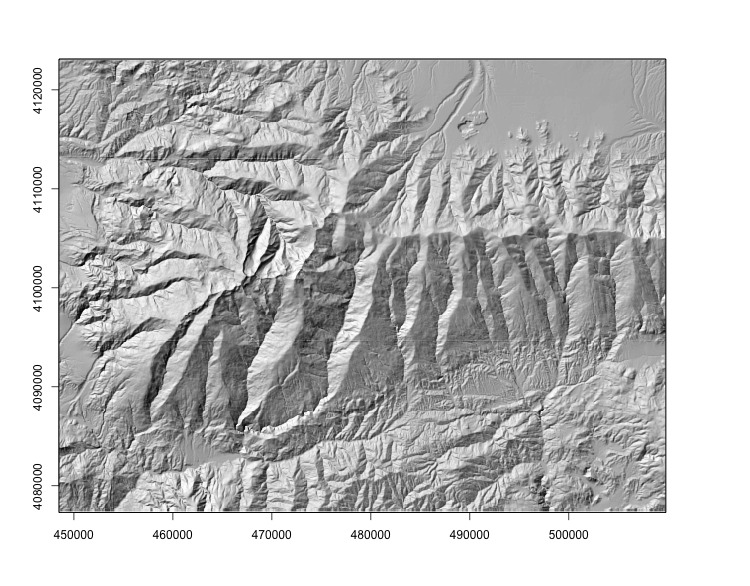 Illumination intensity on Sierra Nevada slopes with the sun in a hypothetical position of 45° elevation, 315° azimut. |
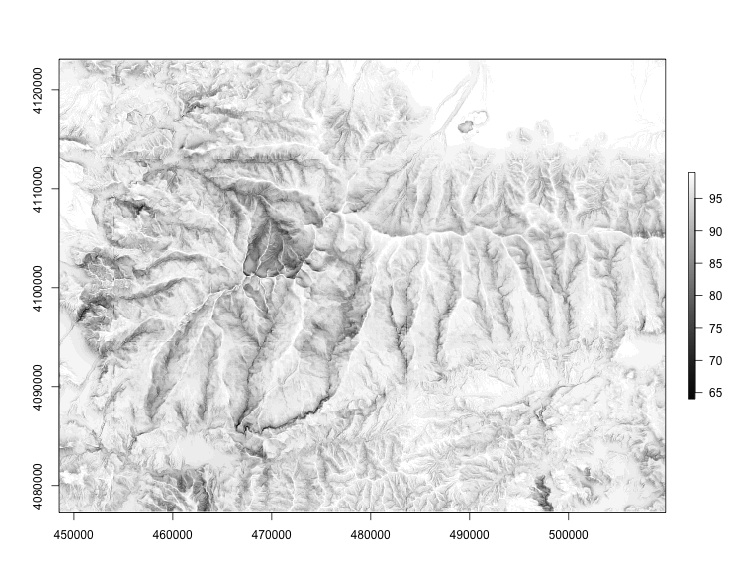 Skyview factor in the Sierra Nevada. |
For the average insolation maps (not potential) we use long term climatic data, climatic reanalysis such as the NCEP CFS or ECMWF ERA, satellite data on cloud cover, radiation measurements when available, and additional parameters to estimate atmospheric transmittance such as Linke turbidity or visibility, to estimate the most likely cloud and aerosol conditions that affect insolation. We also check the best models for diffuse irradiation form the available data, and we evaluate work specific to the area of study (e.g. Boland et. al 2008, 2013; Dervishi et al. 2012; Jacovides et al. 2006; Liu and Jordan, 1960; Pesadillo et al. 2009; Ridley et al. 2010; Ruiz-Arias et al. 2010; Torres et al. 2010). This produces a more realistic map of the values that can be expected at every location on an average day.
We put all this together with the solar position and astronimical algorithms, the atmospheric transmittance and long term climatic data to create a very high resolution map of surface solar radiation. You can check how the process captures the differences on the banks of individual ravines and streams.
The process is time consuming and CPU-intensive, but there is no limit to the resolution that we can provide. With current lidar tools or mapping drones we can resolve even individual house roofs. Contact us if you have any specific needs regarding solar radiation maps.
References
Bird, R. E. and Hulstrom, R. L. (1981a) Review, evaluation and improvements of direct irradiance models, Trans. ASME J. Solar Energy Eng. 103, 182-192.
Bird, R. E. and Hulstrom, R. L. (1981b) A simplified clear sky model for direct and diffuse insolation on horizontal surfaces, Technical Report SERI/TR-642-761, Solar Research Institute, Golden, Colorado. pdf
Boland J, Huang J, Ridley B (2013) Decomposing global solar radiation into its direct and diffuse components. Renewable and Sustainable Energy Reviews, 28, 749–756.
Boland J, Ridley B, Brown B (2008) Models of diffuse solar radiation. Renewable Energy, 33, 575–584.
Bourges, B.: 1985, Improvement in solar declination computation, Solar Energy 35(4), 367-369.
Corripio, J. G.: 2003, Vectorial algebra algorithms for calculating terrain parameters from DEMs and the position of the sun for solar radiation modelling in mountainous terrain, International Journal of Geographical Information Science 17(1), 1-23. pdf
Danby, J. M. Eqn. 6.16.4 in Fundamentals of Celestial Mechanics, 2nd ed. Richmond, VA: Willmann-Bell, p. 207, 1988.
Dervishi S, Mahdavi A (2012) Computing diffuse fraction of global horizontal solar radiation: A model comparison. Solar Energy, 86, 1796–1802.
Iqbal, M. (1983) An Introduction to Solar Radiation, Academic Press, Toronto.
Jacovides CP, Tymvios FS, Assimakopoulos VD, Kaltsounides NA (2006) Comparative study of various correlations in estimating hourly diffuse fraction of global solar radiation. Renewable Energy, 31, 2492–2504.
Kopp, G., and J. L. Lean, 2011: A new, lower value of total solar irradiance: Evidence and climate significance. Geophysical Research Letters, 38, L01706.
Liu BYH, Jordan RC (1960) The interrelationship and characteristics distribution of direct, diffuse and total solar radiation. Solar Energy, 4, 1.
Meeus, J. 1999. Astronomical Algorithms. Willmann-Bell, Richmond, Virginia, USA.
Niemelä S, Räisänen P, Savijärvi H (2001) Comparison of surface radiative flux parameterizations. Part II: Shortwave radiation. Atmospheric Research, 58, 1–18.
Posadillo R, López Luque R (2009) Hourly distributions of the diffuse fraction of global solar irradiation in Córdoba (Spain). Energy Conversion and Management, 50, 223–231.
Reda, I. and Andreas, A. 2003. Solar Position Algorithm for Solar Radiation Applications. 55 pp.; NREL Report No. TP-560-34302, Revised January 2008. http://www.nrel.gov/docs/fy08osti/34302.pdf
Ridley B, Boland J, Lauret P (2010) Modelling of diffuse solar fraction with multiple predictors. Renewable Energy, 35, 478–483.
Ruiz-Arias JA, Alsamamra H, Tovar-Pescador J, Pozo-Vázquez D (2010) Proposal of a regressive model for the hourly diffuse solar radiation under all sky conditions. Energy Conversion and Management, 51, 881–893.
Torres JL, De Blas M, García A, de Francisco A (2010) Comparative study of various models in estimating hourly diffuse solar irradiance. Renewable Energy, 35, 1325–1332.